The cohort is the unit
Self-consistency aggregates it and group-based training treats it as one object — yet it is almost always summarized by votes and margins, never by its own internal geometry.
Fudan University · Preprint — under anonymous review
Routing effective rank — a label-free spectral view of how a cohort of MoE rollouts differentiates, then reconcentrates
Together, apart, together again — the shape of thinking in parallel.
The one idea
Test-time scaling turns inference into a population process: a model doesn't return one answer, it returns a cohort of reasoning rollouts that a vote or a verifier later collapses. Almost every analysis reads that cohort through its final answers. But long before the answers exist, the cohort already has an internal organization — some rollouts compute alike, others take genuinely different routes. In a sparse Mixture-of-Experts model that organization is visible for free, in the routing traces that arrive with every token.
Self-consistency aggregates it and group-based training treats it as one object — yet it is almost always summarized by votes and margins, never by its own internal geometry.
Expert routing is a by-product of decoding, not an added instrument. It arrives with every token, can be read online at any prefix, and needs no labels, no execution, and no answer text.
Build a similarity graph across same-question rollouts and its effective rank says how many independent routing directions the cohort really occupies — a single number that turns out to move on a schedule.
How it is measured
Every step is activation-only. Answer annotations never enter the similarity — they are used solely to locate the commit window and to label same-answer pairs afterwards, so the diagnostic can be computed during serving, before anything is graded.
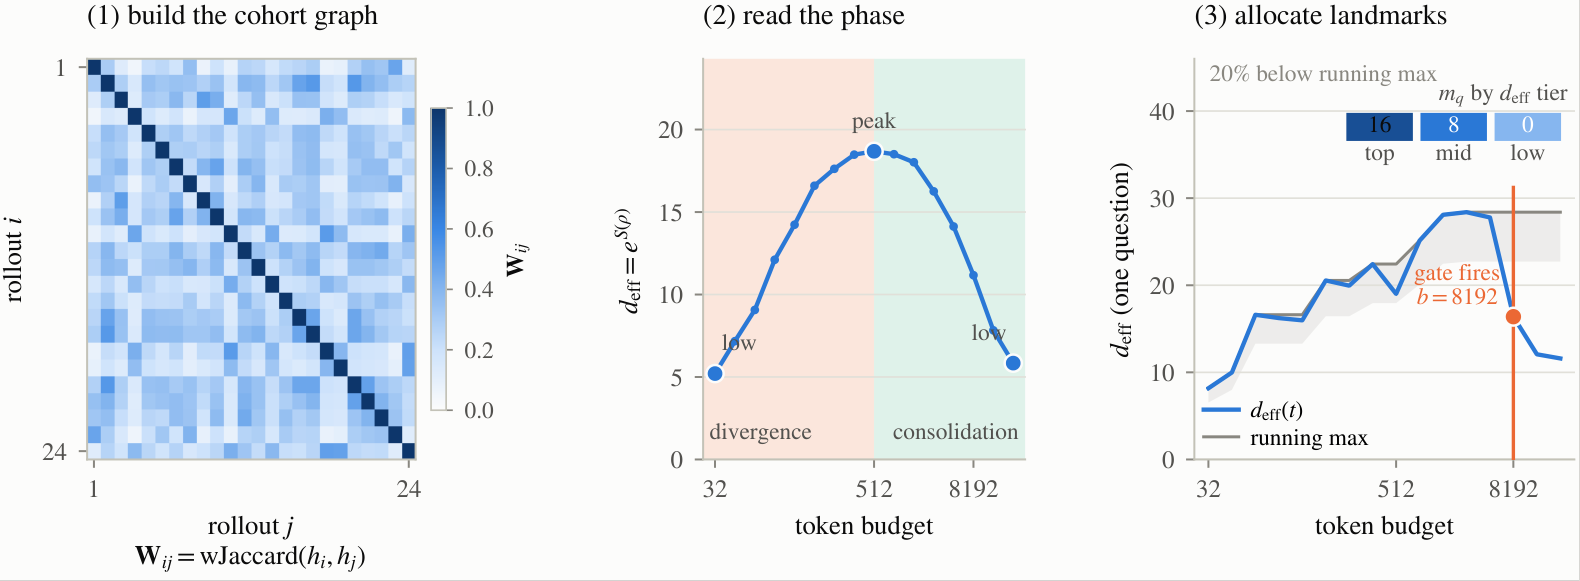
Sample N = 64 rollouts per question and evaluate on a log budget axis (32 → 32,768 tokens). At each budget, every rollout carries a histogram of router gate weight over (layer, expert) slots; the cohort graph holds their weighted-Jaccard overlap.
With pi the normalized eigenvalues of W, the effective rank is the exponential of the spectral entropy. Unlike ordinary rank it discounts numerically tiny directions; unlike graph density it summarizes the whole eigenvalue distribution. Low means a few shared patterns explain the graph; high means more independent directions are needed.
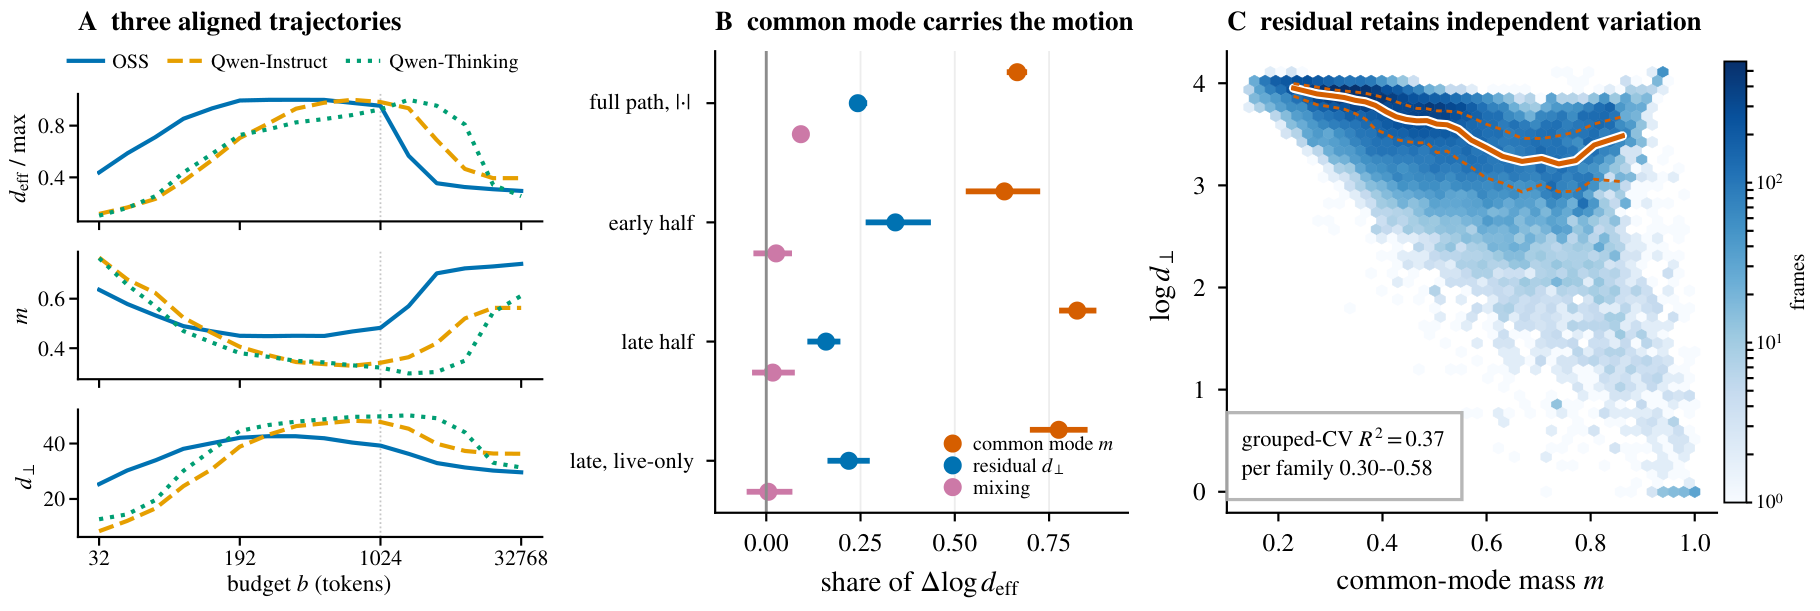
Effective rank can move because the leading eigenmode gains or loses mass, or because the residual spectrum expands. The grouping property of Shannon entropy separates them exactly: with m the leading mode's mass and d⊥ the residual dimensionality, every segment of the trajectory is attributed to common mode, residual, or their mixing.
The arc is a property of aligned routing organization, not of activation volume: permuting expert identities within each rollout — preserving sparsity, per-layer load, and every marginal activation statistic exactly — collapses the prominent-peak rate from 98.5% to 0.0% across all ten configurations. What the spectrum measures is which experts fire together across rollouts.
What the spectrum shows
Two results carry the paper: the trajectory itself, which appears in almost every individual cohort rather than only in the average, and an exact decomposition that says which part of the spectrum is moving.
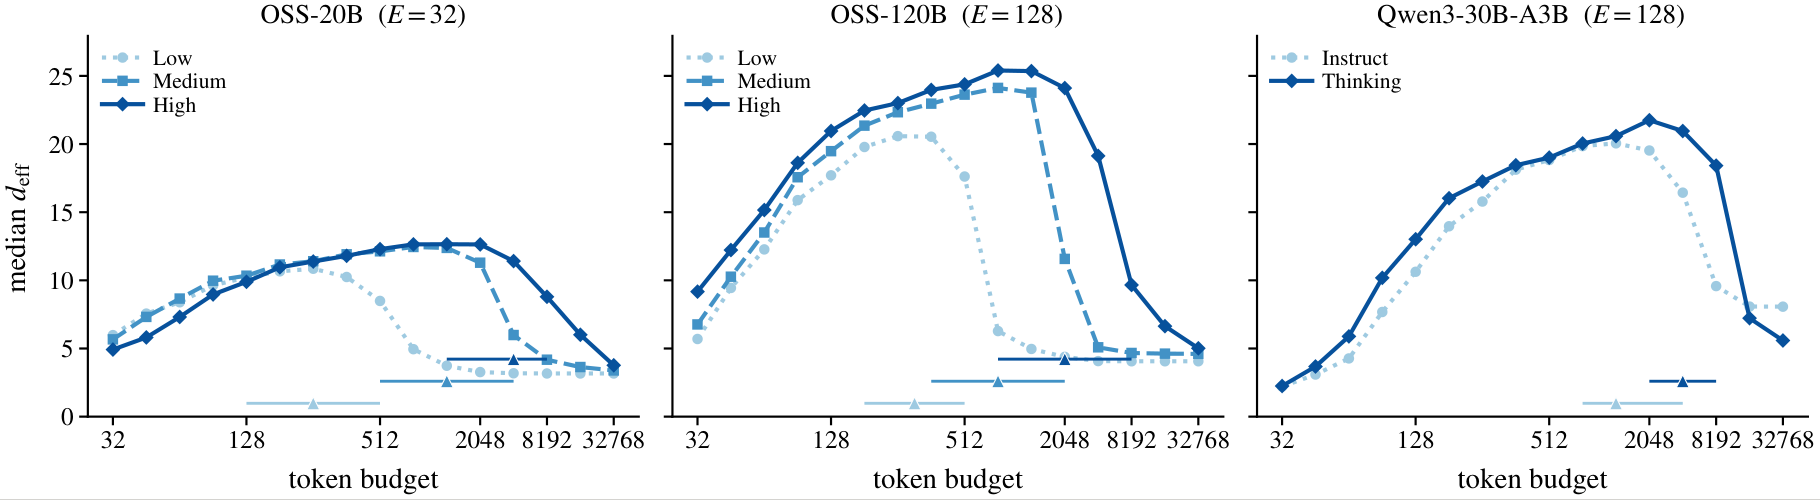
Pooled, deff runs 5.21 → 18.68 (at 512 tokens) → 5.84. A prominent interior maximum appears in 98.5% of 3,105 cohorts — 97.9–99.3% on every benchmark, ≥92.9% on every configuration, and in every difficulty stratum. Timing is architecture-dependent (median peak 768 / 1,024 / 4,096 tokens by family), yet the ordering across datasets is near-fixed (Kendall W = 0.946).
The leading eigenvector is almost exactly the cohort-wide agreement direction (⟨v₁, u⟩² median 0.98; it tracks plain graph density at ρ = 0.987). Mass draining out of that mode and returning accounts for 0.67 of the arc's motion; residual dimensionality contributes 0.24, and mixing 0.09.
The residual spectrum is not a restatement of the common mode: a grouped cross-validated fit of log d⊥ on m explains only 37% of out-of-sample variance, leaving 63% as a second, independent axis of cohort routing geometry.
What the two channels do
Once the arc has an anatomy, the two channels can be given jobs. Pre-registered, Bonferroni-corrected tests locate answer-alignment in the common mode, and locate the effect of reasoning effort in when and for how long the cohort stays differentiated — not in how high it peaks.
Ten MoE configurations × five math/science benchmarks, 64 rollouts per question. The trajectory survives a frozen transfer to held-out code generation (97.7% prominent-peak rate on 1,582 LiveCodeBench-v5 problems) and a binary expert-set graph — so it can be computed from sparse activation indicators alone, without router gate magnitudes.
Across 28,622 adjacent-budget steps (clustered on 318 questions × 10 configurations), a rise in common-mode mass strongly predicts that routing similarity alone recovers which rollouts share a final answer: β = +0.522 [+0.430, +0.609], against a residual partial of just −0.047. A within-question time shuffle collapses both toward zero — the association is temporal, not an artifact of scale.
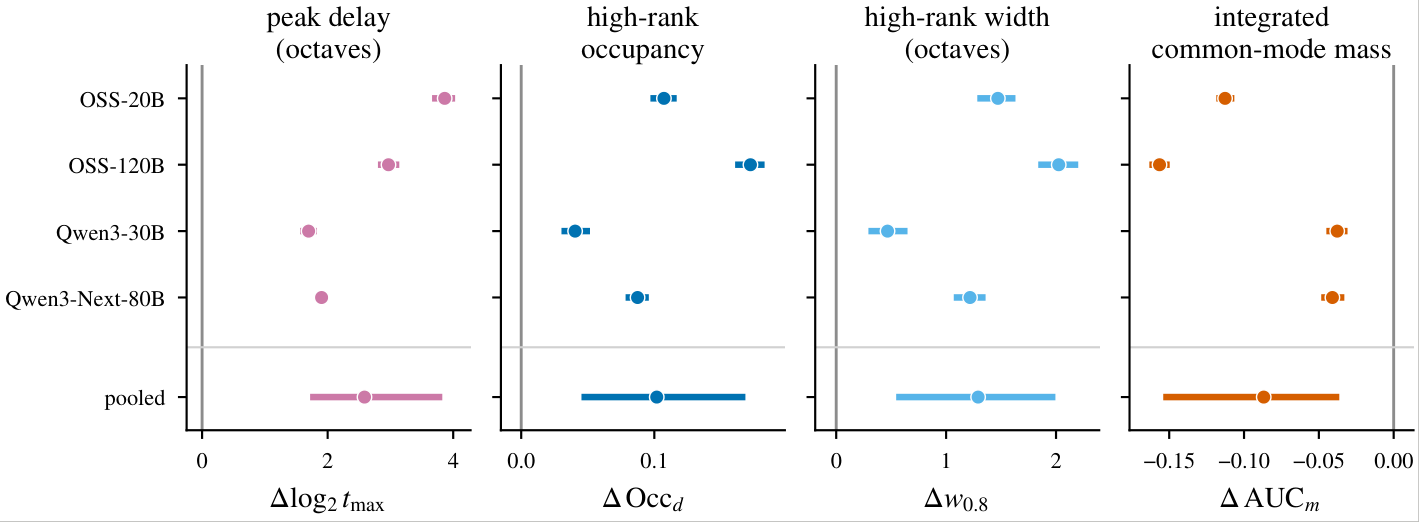
Pairing effort tiers within each architecture, higher effort delays the maximum by +2.59 octaves, widens the high-rank interval by +1.29 octaves, and raises high-rank occupancy by +0.102 — the same sign in all four architectures. The registered peak-height contrast spans zero (+0.104 [−0.079, +0.232]), locating the effect in timing and duration.
Routing effective rank describes cohort geometry, not correctness: for picking the answer, answer-side statistics remain stronger. Its value is that it is label-free and available mid-generation. And because the absolute level of deff depends on the routing representation, expert count, and cohort size, claims are about shape and timing within an architecture — not levels compared across them.
Measured over 10 MoE configurations · 5 benchmarks · 3,105 cohorts gpt-oss-20B/120B at low·medium·high effort, Qwen3-30B-A3B and Qwen3-Next-80B-A3B (Instruct / Thinking) · AIME'24, AIME'25, BRUMO'25, HMMT'25, GPQA · 64 rollouts per question over a 16-point log budget axis
Watch
Cite
@misc{deff2026routingrank,
  title   = {From Concentration to Differentiation and Back:
             Routing Effective Rank in MoE Reasoning Cohorts},
  author  = {Anonymous},
  year    = {2026},
  note    = {Preprint; under anonymous review},
  url     = {https://CckFdu.com/deff},
}
Concentration → Differentiation → and back.